


Datasets collection
Before the training and evaluation of VR-Flipped model, it is necessary to collect multimodal teaching materials such as text, images and audio from various public data sources. The research objects are divided into two kinds of curriculum resources: Small Private Online Courses (SPOC) and Massive Open Online Courses (MOOC). Chinese data are mainly dynamically crawled from the education platform through Scrapy and Selenium, and some restricted data are crawled after obtaining permissions through Application Programming Interface (API) interface. On the international platform, YouTube Data API, Twitter API and Instagram Graph API are used to collect educational videos and pictures. The data is formatted by ffmpeg tools, key frames are extracted by OpenCV to generate image sets, text data is segmented and cleaned by NLTK library, and image data is normalized by Pillow library. Finally, 164,875 data packets are retained and divided into 20 groups, of which 1–14 groups are used for training and 15–20 groups are used for inspection.
The basic situation of the 20 groups of data is shown in Table 1:
Experimental environment
After sorting out, the relevant parameter ranges of 20 groups of data before the experiment are shown in Table 2:
(1) Accuracy verification of cross-modal data fusion: It is evaluated by cosine similarity analysis and Kullback–Leibler (KL) divergence. Cosine similarity analysis is used to measure the similarity of feature vectors among different modes (such as vision and text) and determine the semantic consistency after multimodal fusion30,31. On the other hand, KL divergence is used to evaluate the difference of modal data distribution before and after fusion, and the fusion effect of the model on cross-modal information is tested by quantifying the difference of distribution32.
(2) Automatic matching verification: The accuracy of feedback generated by the model is evaluated by matching the preset test label with the automatically generated feedback result33,34. Precision can be evaluated by the correctness of data labels, and combined with error analysis, the rationality of feedback generated by the model can be tested by Mean Squared Error (MSE), Root Mean Square Error (RMSE), Mean Absolute Error (MAE), Mean Absolute Percentage Error (MAPE) and other indicators to ensure that the feedback generated by the model can meet the expected teaching goals and contents.
In this process, different groups of data are scored for scene coherence, and the scoring equation is:
$$\begin{aligned}{S}_{con}&={a}_{1}\cdot\left(\frac{1}{{F}_{adjust}}\right)+{a}_{2}\cdot\left(\frac{{T}_{coherence}^{0.8}}{{T}_{interaction}^{1.2}}\right)+{a}_{3}\cdot{log}\left(\frac{{C}_{goal}}{100-{C}_{goal}}\right)\\&\quad+{a}_{4}\cdot\frac{{A}_{scene}\cdot sin(\pi\cdot{T}_{coherence})}{1+{T}_{adjust}^{2}}\end{aligned}$$
(13)
\({F}_{\text{adjust}}\) is the adjustment frequency. \({T}_{coherence}\) is the coherence retention time. \({T}_{interaction}\) is the response time of interaction complexity. \({C}_{goal}\) is the consistency value of teaching goals. \({A}_{scene}\) is the scene fitness. \({T}_{\text{adjust}}\) is the scene adjustment time. \({a}_{1}\), \({a}_{2}\), \({a}_{3}\) and \({a}_{4}\) are the weight coefficients, which are used to adjust the influence of different factors on the score.
After adjusting the data of different groups, the score equation is:
$$\begin{aligned}{S}_{robust}&={b}_{1}\cdot\left(\frac{1}{{R}_{response}^{1.5}}+\frac{1}{{T}_{recovery}^{1.2}}\right)+{b}_{2}\cdot{log}\left(1+\frac{{C}_{post-coherence}}{1-\frac{{S}_{stablilly}}{100}}\right)\\&\quad+{b}_{3}\cdot\frac{{e}^{{S}_{stablilly}}}{{R}_{\text{response}}+{T}_{\text{recovery}}+1}\end{aligned}$$
(14)
\({R}_{response}\) is the response time of the adaptive strategy. \({T}_{recovery}\) is the system recovery time. \({C}_{post-coherence}\) is the restored teaching coherence. \({S}_{stablilly}\) is system stability. \({b}_{1}\), \({b}_{2}\) and \({b}_{3}\) are the weight coefficients of different factors, which are used to adjust the score.
(3) Verification of dynamic adjustment ability: Dynamic scene adaptability test is used to analyze the adjustment frequency and consistency of the model in virtual scenes with different complexity to ensure that the model can still maintain the consistency between the scene and the teaching goals when dealing with complex interactions35. Secondly, the adaptive strategy evaluation is used to test whether the model can maintain a certain dynamic adjustment robustness by simulating unexpected events or abnormal operations in the scene.
Parameters setting
In order to meet more abundant teaching scenes, in the training and verification of VR-Flipped, the open classroom teaching videos are selected as input data. In the verification of dynamic adjustment capability, the parameters related to virtual scenes with different complexity and the unexpected events and abnormal operations in the scene are all automated script simulations, and extreme values are taken according to common ranges. The ranges of parameters related to virtual scenes with different complexity are shown in Table 3:
Regarding the calculation method of scene complexity level \({C}_{\text{scene}}\), the equation in this paper is:
$$\begin{aligned}{C}_{scene}&=\frac{{w}_{1}\cdot{N}_{objects}^{1.5}}{{A}_{scene}^{0.75}}+\frac{{w}_{2}\cdot{E}_{interactive}\cdot{log}\left({T}_{render}\right)}{\sqrt{{A}_{scene}}}\\&\quad +{w}_{3}\cdot\left(\frac{{N}_{objects}\cdot{E}_{interactive}}{{T}_{render}^{2}}\right)+\frac{exp({w}_{4}\cdot{T}_{render})}{{A}_{scene}}\end{aligned}$$
(15)
The first term \(\frac{{w}_{1}\cdot{N}_{objects}^{1.5}}{{A}_{scene}^{0.75}}\) indicates the influence of the number of objects and the scene area on the complexity. The number of objects is increased by 1.5 power, while the scene area is reduced by 0.75 power. The second term \(\frac{{w}_{2}\cdot{E}_{interactive}\cdot{log}\left({T}_{render}\right)}{\sqrt{{A}_{scene}}}\) indicates the influence of the number of interactive elements and the rendering time. The rendering time is logarithmic, and considering the nonlinear growth of its influence, the area is reduced by the square root. The third item \(\frac{{N}_{objects}\cdot{E}_{interactive}}{{T}_{render}^{2}}\) combines the influence of the number of objects and interactive elements on the rendering time, and the rendering time reduces the influence on the complexity by the square. The fourth term \(\frac{exp({w}_{4}\cdot{T}_{render})}{{A}_{scene}}\) represents the increase of rendering time with exponential function, which is suitable for describing the significant impact on complexity when rendering time increases rapidly.
The range of parameters related to emergencies and abnormal operations in the scene is shown in Table 4:
Performance evaluation
Accuracy verification of cross-modal data fusion
The cosine similarity analysis results of cross-modal data fusion of VR-Flipped model are shown in Fig. 1:

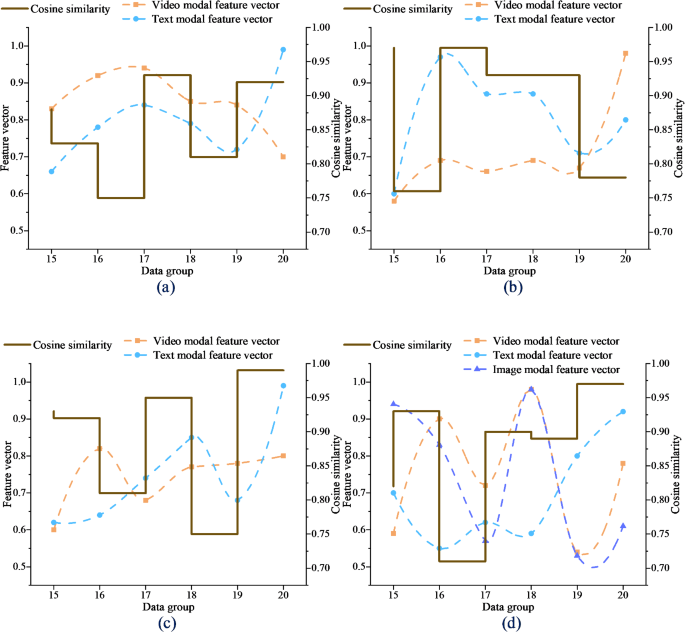
Cosine similarity analysis of VR-Flipped cross-modal data fusion (a) Video-Text (b) Image-Text (c) Video-Image (d) Video-Text-Image.
In Fig. 1, among the six groups of test data, the average similarity of the model in the video-text mode is 0.85, the average similarity of the video-image mode is 0.89, and the similarity of the other two modes is almost close to 1, which shows that the feature vectors of different modes maintain high consistency after fusion. Modal data such as video and image effectively capture the semantic association through fusion, so that the fused information can achieve consistent understanding in multimodal interaction. The high similarity verifies the ability of VR-Flipped model in multimodal data fusion. Even when dealing with complex interactions in VR, it can maintain the synchronization and consistency of multimodal data, which is helpful to improve the efficiency of information transmission in teaching.
The KL divergence analysis results of cross-modal data fusion of VR-Flipped model are shown in Fig. 2:

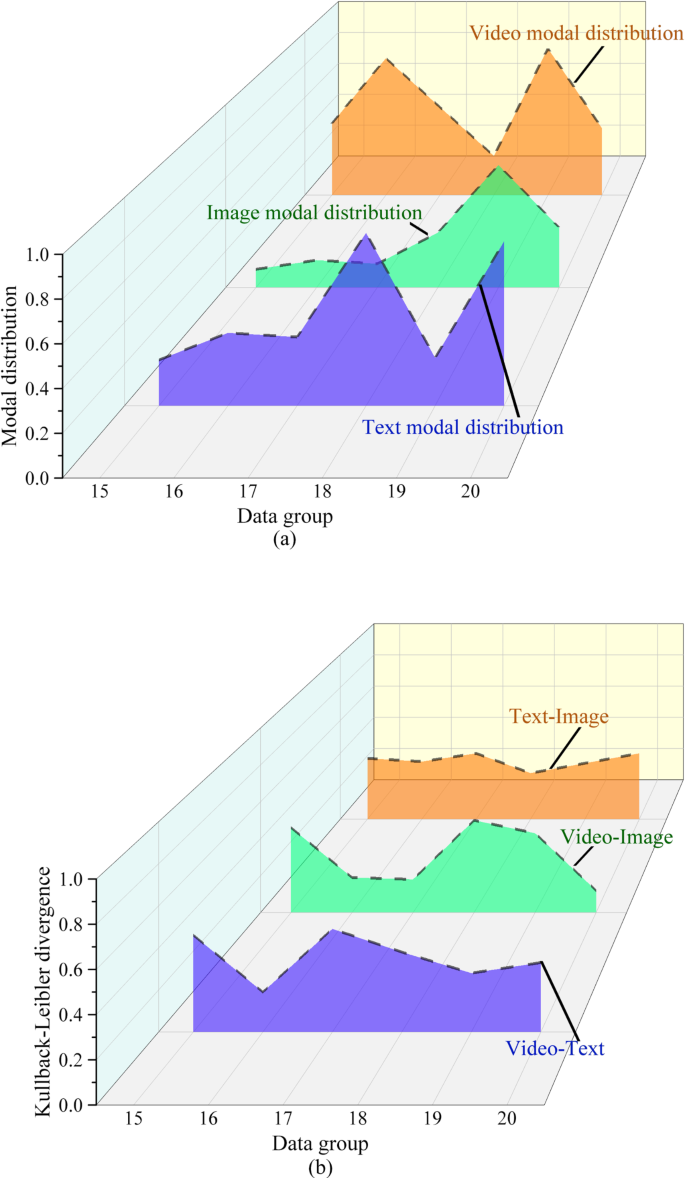
KL divergence analysis of VR-Flipped cross-modal data fusion (a) Modal distribution performance (b) KL divergence results.
In Fig. 2, the KL divergence of visual-text is 0.49 and below, and the lowest is 0.19. The KL divergence of video-image is at least 0.12. The KL divergence value of text-image remains at [0.28, 0.40], and the small difference shows that the distribution of each mode remains relatively stable after fusion. Compared with cosine similarity, KL divergence analysis highlights the accuracy of the model in dealing with different modal data distribution, ensuring that multimodal fusion is not only semantically consistent, but also has no significant deviation in data distribution level. This is very important for optimizing the accuracy of teaching content, which shows that the model can effectively avoid information loss in cross-modal fusion and ensure deep collaboration between different modes.
Automated matching verification
The verification result of automatic matching degree of VR-Flipped model is shown in Fig. 3:

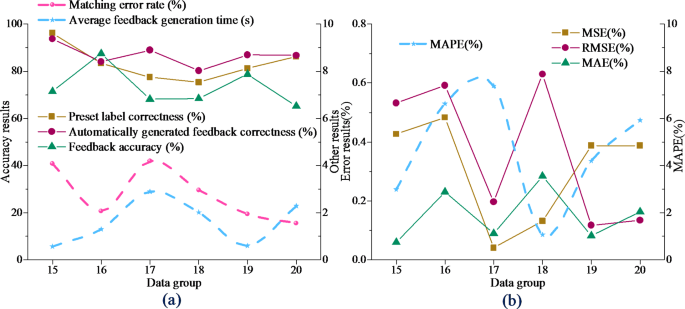
VR-Flipped automatic matching verification (a) Accuracy analysis (b) Error analysis.
In Fig. 3, VR-Flipped shows high superiority in the accuracy of automatically generating feedback. The correctness of preset labels of six groups of test datasets has reached more than 80%, and the accuracy of automatically generating feedback has reached 93.72%. This shows that VR-Flipped can efficiently match multi-modal data, greatly reducing the need for manual intervention and improving the efficiency of feedback generation. The lower MSE and MAE values in the error analysis show that VR-Flipped maintains stability when dealing with complex scenes, ensuring a small feedback error, which proves its robustness advantage in real-time teaching scenes. This makes the VR-Flipped model provide fast and accurate personalized feedback for the classroom and optimize the teaching process.
Dynamic adjustment capability verification
The verification result of the dynamic adjustment capability of VR-Flipped model is shown in Fig. 4:

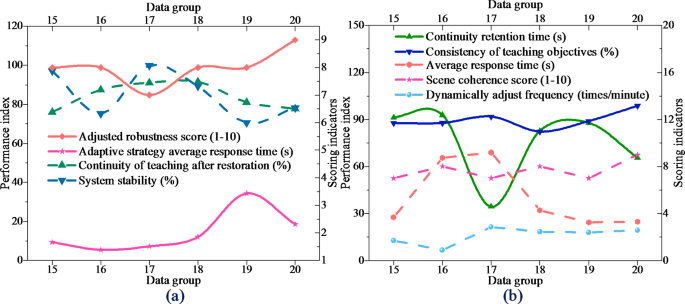
Verification of VR-Flipped dynamic adjustment capability (a) Dynamic scene adaptability test and analysis (b) Sudden problem adaptability test and analysis.
In Fig. 4, VR-Flipped shows high adaptability in different complexity virtual scenes of A1-A10, the adjustment frequency is stable at about 2.5 times/minute, and the scene consistency score remains above 8.6, which proves that the model can still maintain a high degree of consistency with the teaching objectives in complex interaction. This shows that VR-Flipped can quickly respond to scene changes and ensure the consistency and consistency of the learning experience. In the emergency test of B1-B10, the average response time of the adaptive strategy is 3.43 s at most, and the teaching coherence remains at about 85.4% after recovery, which shows that VR-Flipped is robust in dealing with emergencies. Combined with these results, VR-Flipped has a strong adaptability to dynamic adjustment, which can not only cope with complex scenes, but also recover quickly in unexpected situations to ensure the achievement of teaching objectives.
Discussion
By designing and verifying the VR-Flipped model, this paper deeply discusses its application effect in complex interactive scenes. The research results show that VR-Flipped has obvious advantages in multimodal information integration and scene adaptability, especially in video-text and video-image modes. The high similarity and low KL divergence further prove the effective fusion and semantic consistency of the model for multimodal data. This data fusion not only enhances the accuracy of information transmission, but also ensures the consistency of teaching content in VR environment. More crucially, VR-Flipped can respond to learners’ operational behavior in real time through the adaptive feedback mechanism, which effectively reduces the time delay in the process of knowledge internalization and strengthens the teaching effect. The high accuracy of automatically generated feedback also reflects the robustness of the model in personalized learning feedback, ensuring its important position in the intelligent teaching process.
From the perspective of scene use, the experimental design of VR-Flipped fully considers the integration of diverse curriculum resources. Data crawling based on SPOC and MOOC platforms covers theoretical subjects and practical courses, which provides solid empirical support for the multi-modal adaptability of the model. The universality of this data source makes the model particularly outstanding in dynamic adjustment ability and semantic integration consistency, which provides a reliable guarantee for teaching coherence in complex scenes. In addition, the potential application of intelligent feedback and cross-modal analysis ability of VR-Flipped model in large-scale online courses and professional skills training shows its excellent adaptability. For example, in the MOOC environment, the model can effectively meet the complex needs of large-scale learning scenarios by real-time dynamic adjustment and optimization of personalized feedback. In STEM or art courses, its deep integration ability helps to improve the efficiency of mastering complex skills. Although the experimental data has not completely covered all disciplines, the design logic and verification results of the model show that it has a wide range of applicability and provides an important reference for promoting technological innovation and practice in diverse educational scenarios.
link