
Leveraging AI-enabled mobile learning platforms to enhance the effectiveness of English teaching in universities

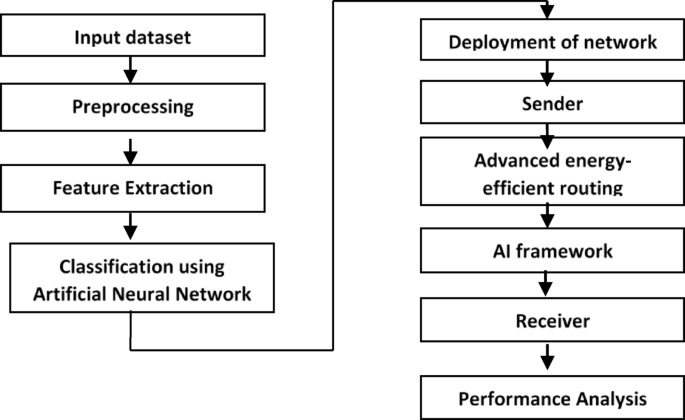
This study presents soft-computing technologies in the context of AI for mobile learning platforms in higher education innovation and development. Figure 1, presented below, provides a schematic illustration of the proposed approach.
Dataset description
Academic Data Sets are available through Kalboard 360, a learning management system. KalBoard 360 is a multi-agent LMS that uses new technology to make learning more successful. Users can acquire study materials in real-time using an internet connection using such a platform.
The data is organized using Experience (xAPI), a software for tracking student activity. The xAPI, which is part of the TLA, allows you to keep track of your student’s progress and actions, such as reading reports and watching videos. The Experience API can be used to find out who is in charge of the learning experience, as well as what activities and objects are involved.
Preprocessing using normalization
The unprocessed data may contain repeated packets and incomplete information. The data is pre-processed to eliminate duplicate and incomplete entries. Given the large size of the dataset, the sample size is reduced, and the database is subsequently normalized. During the normalization process, the Z-score is computed to standardize the data.
$$\:\text{Z}=\:\frac{\text{X}-{\upmu\:}}{{\upsigma\:}}$$
(1)
Where X is the individual data point, µ is the mean of the dataset, σ is the standard deviation of the dataset.
This Z-score standardizes the data by transforming each data point into a unitless value that represents the number of standard deviations away from the mean it is. The result is a dataset where the mean is 0 and the standard deviation is 1.
After calculating the Z-scores, the normalized data is then ready for further statistical analysis. In the next step, we apply a linear regression model to the standardized data, where the relationship between the variables is modeled.
$$\:\text{Y}={{\upbeta\:}}_{0}+{{\upbeta\:}}_{1}\text{X}+{\epsilon}$$
(2)
Where Y is the predicted value (dependent variable), X is the standardized value of the data point (from Eq. 1),\(\:{{\upbeta\:}}_{0}\)is the intercept (constant term),\(\:{{\upbeta\:}}_{1}\)is the regression coefficient (slope), ε is the error term (residual).
Equation (2) models the relationship between the independent variable X and the dependent variable Y using the standardized data. This regression approach allows us to analyze the relationship between variables and make predictions.
Moving forward, we perform additional transformations to the data using statistical moments to adjust the data for further analysis.
$$\:\text{T}={\upalpha\:}\text{X}+{\upbeta\:}$$
(3)
Where T is the transformed value of the data point, α is a scaling factor (the transformation coefficient), β is a shifting factor (constant term), X is the data point to be transformed.
Equation (3) applies a linear transformation to the normalized data to adjust it according to specific analysis needs, scaling the data by α\alphaα and shifting it by β\betaβ.
$$\:\text{M}\text{S}=\sum\:_{\text{i}-1}^{\text{n}}{\left(\frac{{\text{X}}_{\text{i}}-{\upmu\:}}{{\upsigma\:}}\right)}^{2}$$
(4)
Where MS is the moment scale, which quantifies the deviation of the data from the mean, \(\:{\text{X}}_{\text{i}}\) represents individual data points, µ is the mean of the dataset, σ is the standard deviation of the dataset.
Equation (4) calculates the second moment (variance), which measures the spread or dispersion of the data around the mean. This moment scale is used to evaluate how much the data varies, which is important for understanding the dataset’s distribution.
$$\:\text{R}=\text{E}\left[\text{X}\right]$$
(5)
Where R is the expected value (mean) of the dataset, E[X] represents the expectation operator applied to the data X.
$$\:{\text{T}}_{\text{s}\text{c}\text{a}\text{l}\text{e}}={(\text{X}-{\upmu\:})}^{{\upalpha\:}}$$
(6)
Where: Tscale is the scaled version of the data point X, µ is the mean of the dataset, α is a scaling exponent that adjusts the data based on its moment scale.
Equation (6) adjusts the data by scaling it based on the moment (mean) and raising the difference to the power of α\alphaα, which allows further data transformations based on the scale of dispersion.
$$\:{\text{X}}_{\text{n}\text{o}\text{r}\text{m}\text{a}\text{l}\text{i}\text{z}\text{e}\text{d}}=\frac{\text{X}-\text{m}\text{i}\text{n}\left(\text{X}\right)}{\text{m}\text{a}\text{x}\left(\text{X}\right)-\text{m}\text{i}\text{n}\left(\text{X}\right)}$$
(7)
Where Xnormalized is the normalized data point, max(X) and min(X) represent the maximum and minimum values in the dataset.
Finally, Eq. (7) normalizes the data to a standard range (usually between 0 and 1). This ensures that the data is consistent and ready for analysis in subsequent steps.
The data preprocessing steps outlined above transform the original data into a more useful form, ready for further analysis. These steps include removing duplicates, normalizing the data using Z-scores, transforming the data using linear scaling, and applying statistical moments for further adjustments. After these transformations, the data is consistent, standardized, and ready for modeling.
Feature extraction
Principal Component Analysis (PCA) is a technique for reducing the dimensionality of high-dimensional datasets while preserving as much variance as possible. It works by transforming correlated features into a set of linearly uncorrelated variables called principal components. These components are ranked according to the amount of variance they capture from the original data. Unlike previous approaches, PCA removes redundancy by eliminating correlated features.
In PCA, the first step is to standardize the data to have a zero mean, as the technique is sensitive to the scale of the features. Once the data is standardized, the covariance matrix is computed, and the principal components are obtained by solving for the eigenvectors and eigenvalues. The eigenvectors represent the directions of maximum variance, and the corresponding eigenvalues indicate the magnitude of variance along those directions.
The principal components are ranked by their eigenvalues, with the first principal component capturing the most variance. However, PCA typically retains multiple components based on a threshold value (such as the cumulative variance). This threshold ensures that enough variance is retained, and it helps to reduce the dimensionality of the dataset while maintaining the integrity of the data.
Equation (9) calculates the mean of each feature:
$$\:{\upmu\:}\text{x}=\frac{1}{\text{n}}\sum\:_{\text{i}=1}^{\text{n}}{\text{X}}_{\text{i}}$$
Equation (10) calculates the variance of the features:
$$\:{\sigma\:}_{X}^{2}=\frac{1}{n}\sum\:_{i=1}^{n}{({X}_{I}-{\mu\:}_{X})}^{2}$$
Equation (11) calculates the covariance between two variables X and Y:
$$\:\text{C}\text{o}\text{v}(\text{X},\text{Y})=\frac{1}{\text{n}}\sum\:_{\text{i}=1}^{\text{n}}({\text{X}}_{\text{i}}-{{\upmu\:}}_{\text{X}})({\text{Y}}_{\text{i}}-{{\upmu\:}}_{\text{Y}})$$
The two features X and Y are independent if Cov(X, Y) = 0. PCA has several advantages, including removing unrelated characteristics from the dataset, reducing dimensionality, and increasing attribute equivalency by discarding less important features.
Classification using artificial neural network (ANN)
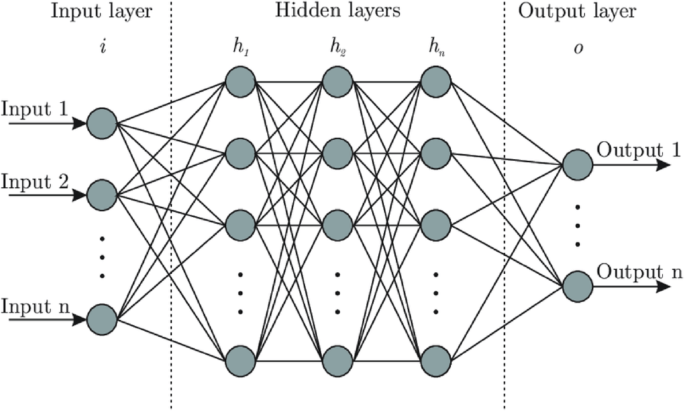
Artificial Neural Networks (ANNs) are a sophisticated method used to model complex, real-world systems by mimicking the architecture and functionality of the human brain. The basic structure of an ANN consists of three main layers: the input layer, the hidden (or middle) layers, and the output layer. Each layer consists of interconnected artificial neurons that process and transmit information, allowing the network to learn and improve its performance through training.
In our ANN model, numerical data is processed through layers that extract feature sets and compute activation values. The interconnected neurons send data to the next layer, where hidden neurons calculate weighted aggregates of inputs. The output layer applies an activation function (e.g., linear, sigmoid, or hyperbolic tangent) to produce the final output. These activation functions determine the output based on the weighted inputs received22,23,24,25.
The training process of an ANN involves multiple epochs, where each epoch represents one complete cycle of updating the weights of the connections based on the input data. This iterative process continues until the model achieves a predefined level of accuracy or meets specific validation criteria. The hidden weights are adjusted through backpropagation, allowing the network to minimize errors in its predictions26,27.
To evaluate the performance of the trained ANN, the model is tested using separate test data (Fig. 2). This helps ensure that the network can generalize well to new, unseen data, making its predictions more reliable and accurate28,29.
In our implementation, the network architecture consists of X hidden layers, each containing Y neurons. The data was split using a 70 − 30 split (training-test split) or k-fold cross-validation for model evaluation. Key hyperparameters used during training include a learning rate of 0.01, a batch size of 32, and the sigmoid activation function for the output layer. These hyperparameters were tuned using grid search to find the optimal configuration.
AI in higher education innovation and reform
The integration of Artificial Intelligence (AI) in higher education is poised to revolutionize teaching and learning methodologies. The emergence of mobile learning platforms, powered by AI, facilitates a more dynamic and responsive educational environment. AI technologies enable real-time analysis of student data, providing educators with valuable insights into learners’ psychological states and learning conditions30.
AI-driven tools can assist instructors in developing data-driven classroom designs tailored to individual student needs. This personalization allows for the creation of diverse learning pathways and instructional materials that align with each student’s unique characteristics and learning preferences31. For example, AI platforms can adapt content delivery based on real-time assessments of student engagement and comprehension, fostering a more inclusive and effective learning experience32.
Furthermore, the collaboration between educators and AI technologies enhances pedagogical strategies by promoting active learning and engagement. The design of contemporary educational models that incorporate AI can significantly improve student engagement and skill development33. This synergy enriches the learning experience and prepares students for a future where digital literacy and adaptability are essential.
In conclusion, the application of AI in higher education represents a transformative opportunity to innovate and reform educational practices. By harnessing AI technologies, educators can create personalized, engaging, and data-driven learning experiences that cater to the diverse needs of students, ultimately enhancing educational outcomes and preparing learners for the challenges of the digital age.
Advanced energy efficient routing algorithm
The proposed advanced energy-efficient routing algorithm uses intelligent agents to facilitate communication within the network. By leveraging cluster formation and cluster head selection procedures, the algorithm seeks to identify the most energy-efficient routing paths. Below are the detailed steps of the routing process:
link


