Study preferences and exam outcomes in medical education: insights from renal physiology | BMC Medical Education

Sample population and grade comparison
Out of 189 eligible MED4 students, 72 (38% response rate) completed the questionnaire and provided exam identifiers for anonymous grade linkage. The grade distribution centered around a ‘C’ for both the sample and the entire class, as shown in Fig. 1A. Regression analyses revealed a high degree of explanation (R² = 0.61) for the linear relationship between total exam scores and renal physiology scores across the whole class, the sample population, and the non-respondents. The slopes and intercepts were similar across these groups (p = 0.96), indicating a consistent pattern in the relationship between total scores and renal physiology scores. However, the sample population exhibited a tendency toward higher performance, particularly in the lower-performing group, as depicted in Fig. 1B. Compared to the nonrespondents (n = 117), the difference in total and renal scores was statistically significant (F (5, 750) = 10.24, p < 0.0001), indicating some degree of self-selection among the respondents.

Comparison of exam grades and scores between the whole class and the sample population. Left panel: Grades are categorized into AB (n = 24/n = 41), C (n = 24/n = 71), and DEF (n = 24/n = 77). Right panel: Scores, represented as fractions of the total obtainable score, are plotted in ascending order against the cumulative fraction of students for the whole class (n = 189) and the sample population (n = 72), with values ranging from 1/n to n/n
Perceived determinants of success in renal physiology learning
When evaluating factors that are critical to successful learning of renal physiology, 83% of the students across all the performance groups considered the communication skills of teachers to be ‘Very important’. Self-effort and teachers’ professional competence followed, with 67% and 58%, respectively, of the students rating these as ‘Very important’.
Notably, all the ‘high performers’ considered self-effort ‘Important’ or ‘Very important’, while 4% of ‘mid performers’ and 8% of the ‘low performers’ rated it merely ‘Somewhat important’. Teachers’ charisma was deemed the least influential, with 42% of ‘high performers’, 16% of ‘mid performers’, and 36% of ‘low performers’ reporting it ‘very important’.
Spearman’s rho analysis showed that students’ perceived importance of teachers’ professional competence positively correlated with their performance in renal physiology (rho, ρ = 0.23, p = 0.05), their perceived importance of self-effort (ρ = 0.25, p = 0.03), teacher communication skills (ρ = 0.23, p = 0.05), and the valuation of the following methods for learning renal physiology: TBL (ρ = 0.26, p = 0.03), interactive lessons (ρ = 0.29, p = 0.01), and instructive videos (ρ = 0.25, p = 0.04). However, these correlations were not significant after Bonferroni correction for repeated analyses (p adjusted > 0.05).
Additionally, self-effort was positively correlated with the perceived usefulness of interactive lessons (ρ = 0.32, p = 0.007, p adjusted > 0.05) and instructive videos (ρ = 0.30, p = 0.01, p adjusted > 0.05). In contrast, teachers’ charisma was negatively correlated to the time spent on preparing for the renal physiology lab (ρ = -0.34, p = 0.004, p adjusted > 0.05), and TBL (ρ = -0.24, p = 0.04, p adjusted > 0.05) as well as the valuation of ‘The renal Pod’ (ρ = -0.29, p = 0.01, p adjusted > 0.05) and ‘Renal physiology lab’ (ρ = -0.23, p = 0.05, p adjusted > 0.05).
Interestingly, the reported time ‘spent learning renal physiology compared to other subjects in MED4’ correlated positively to its perceived difficulty (ρ = 0.43, p < 0.001, adjusted p < 0.01) as well as difficulty of heart physiology (ρ = 0.45, p < 0.001, adjusted p < 0.01). Further, the perceived difficulty of renal physiology correlated positively with that of heart physiology (ρ = 0.51, p < 0.001, adjusted p < 0.01) and negatively to the valuation of TBL (ρ = -0.34, p = 0.004, p adjusted > 0.05), textbook (ρ = -0.33, p = 0.02, p adjusted > 0.05) and recommendation for continuing formative assignments with feedback (ρ = -0.30, p = 0.04, p adjusted > 0.05).
Linking academic performance with students’ valuation of learning tools
The most favored educational materials among the respondents were instructive video videos (96%), interactive lessons (94%), renal physiology labs (89%), and The Renal Pod (79%), each rated as ‘very useful’, ‘useful’ or ‘somewhat useful’.
As shown in Figs. 2 and 3, ‘high performers’ and ‘mid performers’ predominantly rated ‘Interactive lessons’ (79%), ‘Asynchronous videos’ (75%), and ‘TBL’ (60%) as ‘very useful’ or ‘useful’. Conversely, ‘low performers’ preferred ‘Asynchronous videos’ (79%), ‘The Renal Pod’ (63%), and ‘Renal physiology lab’ (58%) as their top learning resources.
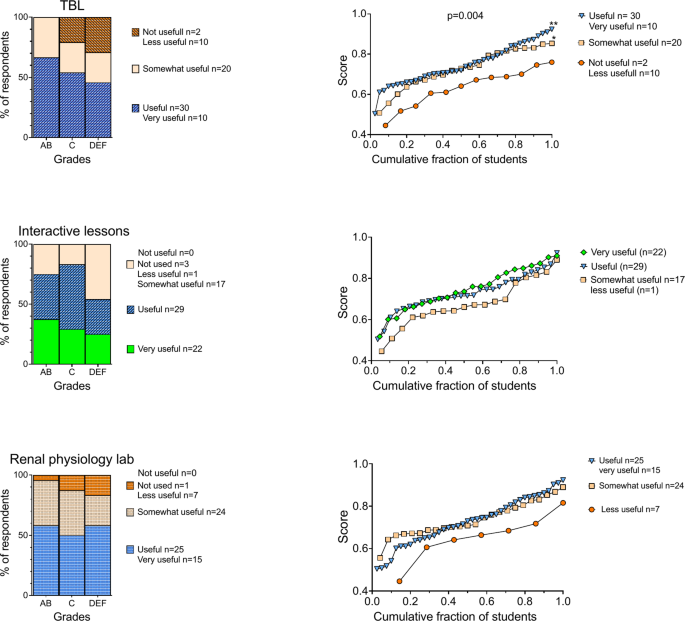
Comparison of the perceived usefulness of active learning methods and academic performance. The left panel shows the distribution of students’ preferences across different grade categories; high (AB), mid (C), and low (DEF) performers. The bars are divided into segments representing preference-cohorts as indicated by the legends. The right panels depict exam scores sorted from low to high as a function of the cohort-normalized number of students. Upper panel. Significant differences in exam scores were observed among the preference cohorts for ‘TBL’. Mean exam scores for the three cohorts (right panel): ‘Very useful/useful’; 74.6% ± 9.7%, n = 40), ‘Somewhat useful’; 72.8% ± 10.0%, n = 20, ‘Not very useful/not useful’; 63.4% ± 9.5%, n = 12. ANOVA: F (2, 69) = 6.121, p = 0.0036. Post hoc tests: **p = 0.0024 between the ‘Very useful/useful’ and ‘Not very useful/not useful’ cohorts, and *p = 0.0286 between the ‘Somewhat useful’ and ‘Not very useful/not useful’ cohorts. Middle and lower panels. No significant differences in exam scores were seen among the preference-cohorts for ‘Interactive lessons’ or ‘Renal physiology lab’
Students who rated active learning methods (TBL, interactive lessons and the renal physiology lab) as most useful also obtained the highest exam scores (Fig. 2). This trend was particularly pronounced for TBL, where the average exam score in the ‘Very Useful’ and ‘Useful’ cohorts was 0.75 ± 0.10, compared to 0.63 ± 0.09 in the ‘Not Very Useful’ and ‘Not Useful’ cohorts (p = 0.002). The ‘Somewhat Useful’ cohort also outperformed those who found TBL ‘not useful’ or ‘not very useful’ (p = 0.029).
‘Other resources’, representing self-found online materials, and ‘Textbook’ were perceived as the least useful across all groups (Fig. 3). Notably, a trend emerged where ‘high performers’ seemed to value textbooks more than ‘low performers’ (21% vs. 8%), while ‘low performers’ showed a greater inclination towards ‘Other resources’ compared to ‘high performers’ (50% vs. 25%).
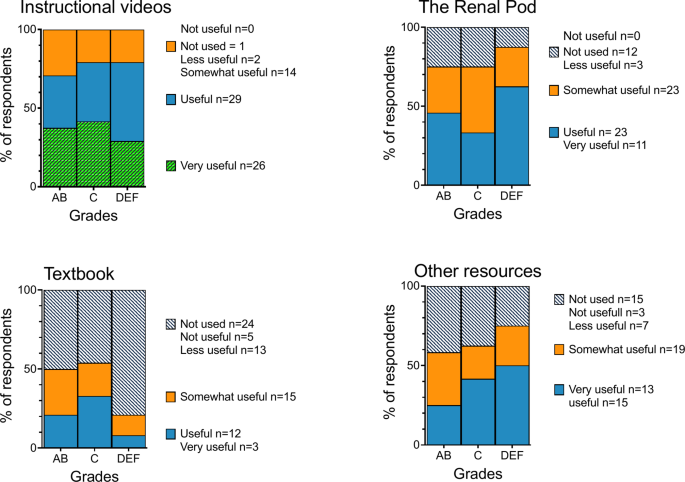
Comparison of perceived usefulness of indicated learning methods and academic performance (p > 0.05). See Fig. 2 for a detailed explanation of the panel structure
Spearman’s rho analysis further supported these observations, revealing positive correlations between overall MED4 exam score and students’ valuation of TBL (ρ = 0.28, p = 0.02, p adjusted > 0.05) and interactive lessons (ρ = 0.27, p = 0.03, p adjusted > 0.05). Conversely, MED4 exam score correlated negatively with perceived usefulness of self-found online resources (ρ = − 0.27, p = 0.04, adjusted > 0.05), suggesting that reliance on these resources might not be as beneficial for academic success.
Perception of subject difficulty and its relationship with academic performance
The survey data showed that circulatory and renal physiology were the most challenging subjects, with only 4% of students finding them ‘Very easy’ or ‘easy’. Specifically, 71% rated circulatory physiology and 33% rated renal physiology as ‘difficult’ or ‘very difficult’. In contrast, nutrition was perceived as the least challenging, with 58% considering it ‘easy’ or ‘very easy’, and none finding it ‘very difficult’.
Students who perceived subjects as less challenging tended to perform better academically. For instance, only 4% of ‘high performers’ found renal physiology ‘very difficult,’ compared to 8% of ‘mid performers’ and 21% of ‘low performers’. This expected trend across disciplines is exemplified in Fig. 4, which shows that perceived difficulty in renal physiology and endocrinology is associated with lower exam scores.
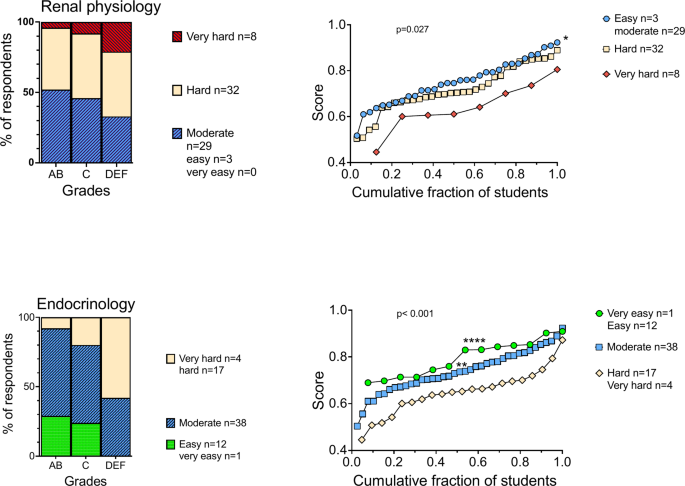
Comparison of perceived difficulty of renal physiology and academic performance. See Fig. 2 for a detailed explanation of the panel structure. Upper panel. Significant differences in exam scores were observed based on the perceived difficulty of renal physiology. Mean exam scores for the three cohorts (right panel): ‘Easy/moderate’; 75.1% ± 9.7%, n = 32, ‘Hard’; 71.8% ± 10.3%, n = 33, ‘Very hard’; 64.3% ± 10.8%, n = 8. ANOVA: F (2, 70) = 3.793, p = 0.0273. Post hoc tests: *p = 0.0228 between the ‘Easy/moderate’ and ‘Very hard’ cohorts. Lower panel: Significant differences in exam scores were observed based on the perceived difficulty of endocrinology. Mean exam scores for the three cohorts (right panel): ‘Very easy/easy’; 79.5% ± 7.8%, n = 13, ‘Moderate’; 73.8% ± 9.2%, n = 39, ‘Hard/very hard’; 64.9% ± 9.7%, n = 21. ANOVA: F (2, 70) = 11.49, p < 0.0001. Post hoc tests: ****p < 0.0001 between the ‘Very easy/easy’ and ‘Hard/very hard’ cohorts, and **p = 0.0017 between the ‘Moderate’ and ‘Hard/very hard’ cohorts
These observations align with Spearman’s rho analysis, revealing negative correlations between MED4 exam score and perceived difficulty across the MED4 curriculum. Specifically, perceptions of difficulty in endocrinology (ρ = − 0.52, p < 0.0001, p adjusted < 0.01), heart physiology (ρ = − 0.35, p = 0.002, p adjusted > 0.05), renal physiology (ρ = − 0.30, p = 0.01, p adjusted > 0.05), and digestive system (ρ = − 0.25, p = 0.04, p adjusted > 0.05).
Similarly, endocrinology showed a pattern where perceived difficulty correlated positively with perceived difficulty in other topics such as digestive system (ρ = 0.46, p < 0.001, p adjusted < 0.01), respiratory system (ρ = 0.29, p = 0.01, p adjusted > 0.05), Heart (ρ = 0.27, p = 0.02 p adjusted > 0.05 and circulation (ρ = 0.26, p = 0.03 p adjusted > 0.05. These correlations, along with negative correlations with MED4 exam score (ρ = − 0.52, p < 0.001, p adjusted < 0.01) as well as renal score (ρ = − 0.34, p = 0.003, p adjusted > 0.05) and the valuation of TBL (ρ = − 0.24, p = 0.04, p adjusted > 0.05) support the conclusion that students’ perceptions of subject difficulty are aligned with both their preferred learning methods and their academic outcomes in the broader MED4 curriculum.
The influence of preparation time on academic performance in active learning settings
The left panels of Fig. 5 indicate that mid-performers (grade C) are more likely to dedicate extensive time to preparation (more than 2 h), whereas high performers (grades A and B) tend to be more efficient with shorter preparation times (less than 30 min), Among low performers (grades D, E, and F), the most frequently reported preparation time is less than 30 min, followed by 1–2 h, with a notable portion also reporting no preparation.
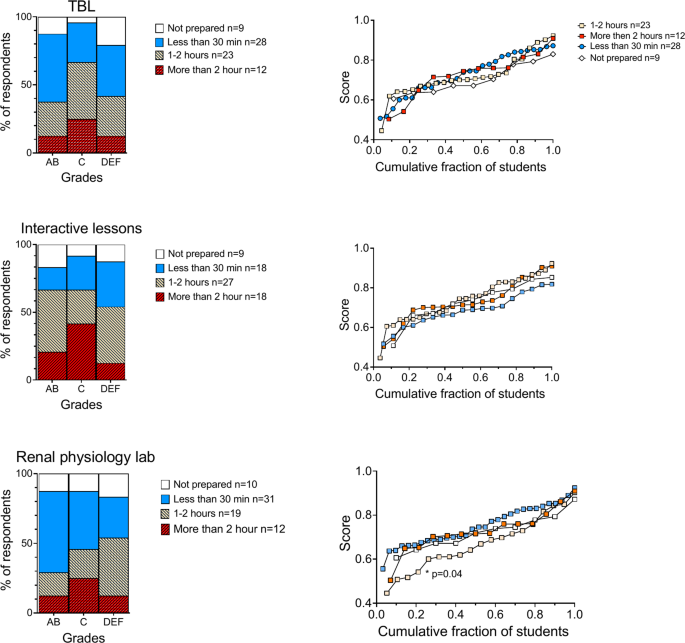
Comparison of time spent preparing for active learning sessions and academic performance. See Fig. 2 for a detailed explanation of the panel structure. Upper and middle panel. No overall significant difference for TBL and Interactive lessons (p > 0.05). Lower panel. Mean exam scores for the four cohorts (right panel) based on time spent preparing for the ‘Renal Physiology lab’: ‘Not prepared’; 72.4% ± 7.9%, n = 10, ‘Less than 30 min’; 75.1% ± 8.9%, n = 31, ‘More than 1 h’; 67.2% ± 12.5%, n = 19, ‘Anything more than 2hurs’; 73.0% ± 9.7%, n = 14. ANOVA: F (3, 70) = 2.498, p = 0.0667. Post hoc tests: *p = 0.0400 between the ‘Less than 30 min’ and ‘More than 1 h’ cohorts
As shown in Fig. 5, (lower right panel), an 11% lower exam score was noted in the cohort spending 1–2 h (0.672 ± 0.125) compared to those spending less than 30 min (0.751 ± 0.089) on preparation for ‘The renal physiology lab’ (adjusted p = 0.04). This suggests that while time spent preparing is a factor, the quality and effectiveness of study strategies are likely more crucial for academic performance.
Notably, a positive correlation was observed between the reported time students spent on interactive lectures and their perceived usefulness (ρ = 0.38, p = 0.01, p adjusted > 0.05), as well as with the time dedicated to preparation for these lectures (ρ = 0.51, p < 0.0001, p adjusted < 0.01) and the ‘Renal physiology lab’ (ρ = 0.43, p < 0.0001, p adjusted < 0.01). Conversely, a negative correlation was found with ‘self-found online resources’ (ρ = -0.38, p = 0.008, p adjusted > 0.05). However, as with time spent on other available learning methods, no correlation was found between reported preparation time and exam score.
These findings highlight the interconnectedness between the time spent on preparation for active learning methods, their perceived value, and academic performance.
Comparison of the time spent on renal physiology relative to other subjects
While approximately 70% of respondents reported spending more time on renal physiology compared to other MED4 subjects, this increased study time did not translate into significantly different academic performance across the cohorts (Fig. 6 upper panel). Specifically, the average exam score for respondents who spent considerably more time on renal physiology was 69.6% ± 12.4%, compared to 72.2% ± 9.9% for those who spent more time, and 73.4% ± 11.0% for those who spent a similar amount or less time studying the subject (p = 0.69).
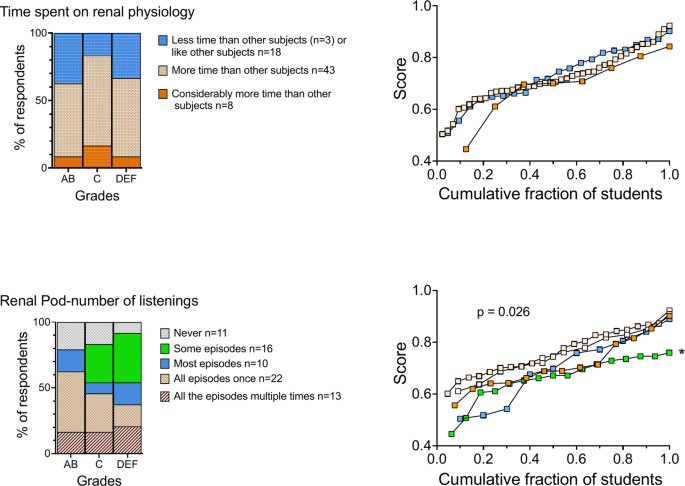
The impact of study time and podcast engagement on academic performance. See Fig. 2 for a detailed explanation of the panel structure. Upper panel. No significant difference in academic performance based on time spent studying renal physiology (p > 0.05). Lower panel. Significant differences in performance based on podcast usage. Mean cohort exam scores (right panel): ‘All the episodes multiple times’; 71.4% ± 10.0%, n = 13 ‘All episodes once’; 76.3% ± 8.7%, n = 22 compared to those who listened to only some episodes: 66.2% ± 8.7%, n = 16. ANOVA, F (4, 67) = 2.958, p = 0.0259) post hoc test: *p = 0.0217
Podcast engagement and its impact on academic performance
As depicted in Fig. 6 (lower left panel), a substantial majority (85%) of respondents engaged with ‘The Renal Pod’, with 63% having listened to most or all episodes at least once, and 18% reporting multiple listenings of all episodes. Notably, high-performing students (AB) in contrast to their low-performing peers (DEF), predominantly listened to all the episodes once (46%) or not at all (21%) suggesting a strategic approach to podcast utilization.
The results revealed a statistically significant differences (p = 0.026) in academic performance based on podcast usage (Fig. 6, lower right panel). Specifically, students who listened to all episodes once achieved higher mean exam scores (76.3% ± 8.7%) compared to those who listened to only some episodes (66.2 ± 8.7%). This finding suggests that moderate and consistent engagement with the podcast is more beneficial for academic success than sporadic listening.
Despite these nuanced usage patterns, a strong desire for more podcast-based learning resources was expressed across all performance levels, with 69 out of 72 respondents advocating for broader podcast availability.
The impact of formative assignment perceptions on academic performance
The introduction of the formative assignment pilot in Spring 2022 allowed us to examine its impact on the academic performance of MED4 students. This assignment involved collaborative problem-solving and individual feedback sessions, as described in the study context.
Students across all grade categories expressed a preference for the expansion or continuation of the formative assignment. Specifically, 50% of AB, 42% of C, and 46% of DEF students supported this view (Fig. 7, left panel). However, 29% of DEF students recommended discontinuation compared to only 4% of AB students (red segments in Fig. 7, left panel). Additionally, students could respond with ‘other’, which required a free-text explanation. The majority of these free-text responses also supported the formative assignment, indicating a general preference for its continuation or expansion.

Comparison of academic performance and recommendations for the formative assignment, showing significant differences in exam scores based on students’ perceptions of the formative assignment. See Fig. 2 for a detailed explanation of the panel structure. Mean exam scores for the three cohorts (right panel): ‘Should be expanded or continued’; 73.2% ± 10.3%, n = 33, ‘Should be discontinued’; 63.4% ± 10.4%, n = 12, and ‘Other’; 75.0% ± 8.7% n = 27. ANOVA: F (2, 69) = 6.136, p = 0.0035. Post hoc tests: *p = 0.0117 between the ‘Should be expanded or continued’ and ‘Should be discontinued’; **p = 0.0029 between ‘Other ‘ and ‘Should be discontinued’ cohort
The right panel of Fig. 7 shows that students advocating for the continuation or expansion of the formative assignment had a 13% higher mean exam score (73.2% ± 10.3%) compared to those who preferred its discontinuation (63.4% ± 10.4%, adjusted p = 0.01). ‘Other’ respondents, who largely supported the pilot, had a 15% higher mean exam score (75.0% ± 8.7%, adjusted p = 0.003). Altogether, these results indicate potential benefits of the formative assignment approach.
link


